


0 引言
目前,有关供电企业配电网发展综合评价方面的研究已取得了一定的成果[3-13]。如:文献[3]提出基于层次分析法(analytic hierarchy process,AHP)模型的评价指标权重设计策略,运用改进AHP模型对青海省各县级供电企业进行分析,但是没有考虑地区差异化的影响,缺乏客观性;文献[4]提出将AHP与聚类分析综合评价方法相结合,用于县公司之间评优;文献[5]通过主成分分析法以及相关性分析法给出适用于电网评价的指标体系,并考虑地区环境及经济的不同,采用聚类分类进行综合评价;文献[6]提出基于数据包络分析法(data envelopment analysis,DEA)对县级供电企业的生产效率进行评价,体现各县公司生产经营现状水平,反映管理和技术进步成效;文献[7]提出基于Delphi-AHP模型的电网生产经营及发展指标体系和评价方法,并进行了实证应用分析。然而,以上研究主要集中在县级电网发展与生产经营水平的评价,并未深入探究导致电网发展水平落后的根本原因。
本文通过分析县级供电企业电网发展及生产经营的影响因素,以宁夏回族自治区县级供电企业为例,结合其电网发展具体特征,建立适用于县级供电企业电网发展经营分析的指标体系,并采用改进的基于指标相关性的指标权重确定(criteria importance through intercriteria correlation,CRITIC)-熵权法确定指标体系中各指标权重值,对企业电网发展水平进行综合评价,找出企业发展中的不足,提出县级供电企业对配电网未来发展重点管理的建议,从而为更好地引导县级供电企业配电网的规划建设、提高配电网发展质量提供参考。
1 评价指标体系构建
1.1 构建原则及思路
在评价指标体系构建中需要遵循八大原则[14],即全面性、层次性、独立性、功能性、可操作性、差异性、有效性以及继承性。结合县级供电企业配电网发展及生产经营自身的特点,在考虑指标的可量化性及相关数据的可获得性、可靠性、简明性的基础上,应使指标体系尽可能地涵盖基层供电企业配电网发展、生产经营的全过程及各方面。与此同时,指标之间的组合不仅应具有内在联系,还需要有一定的层次性,尽量避免信息重叠。通过分析县级企业配电网发展及生产经营的影响因素,建立合理的评价模型。
1.2 指标体系具体内容
电网服务于用户,用户侧的需求也是电网发展经营中的重要影响因素,因此本文中将95598服务满意度、业扩工单数与营业户数比以及报修工单数与营业户数比列入评价指标体系。
图1
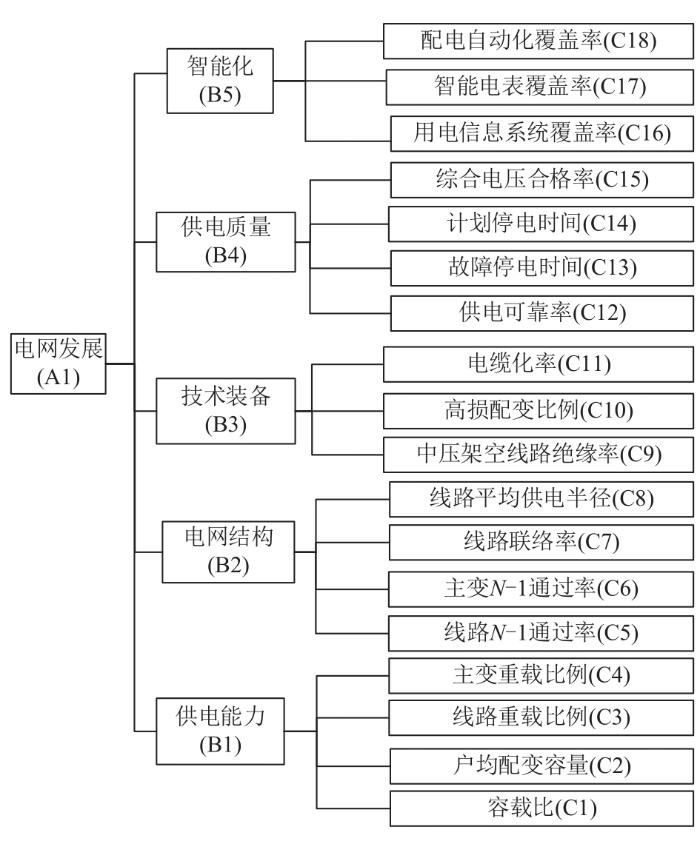
图1
电网发展模块评价指标体系
Fig. 1
Evaluation index system of power grid development module
图2
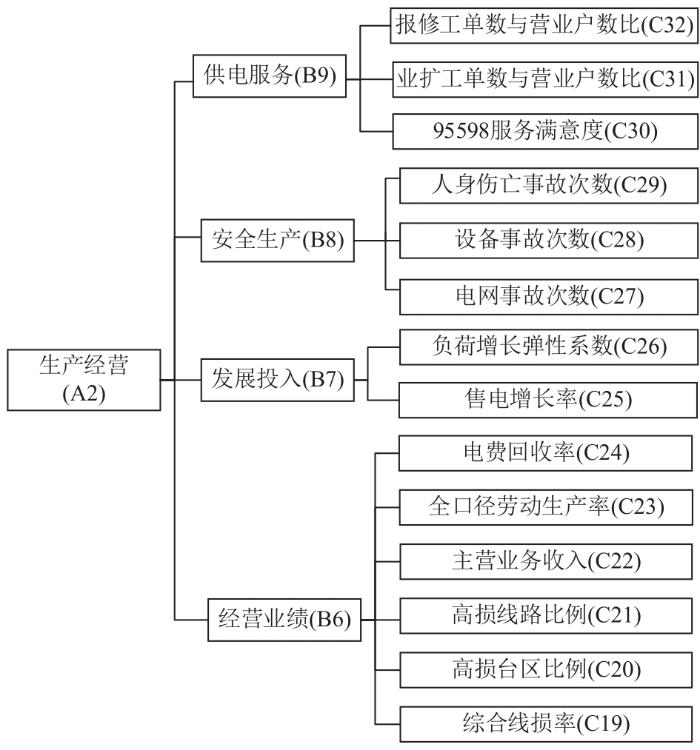
图2
生产经营模块评价指标体系
Fig. 2
Evaluation index system of production and operation module
依据《配电网规划设计技术导则》和配电网滚动规划数据表,并结合专家意见给出各指标情况说明,如表1所示。
表1 各指标情况说明
Tab. 1
| 一级指标 | 二级指标 | 三级指标 | 合理取值 | 注释 |
|---|---|---|---|---|
| A1 | B1 | C1 | 1.8~2.2 | 指某一供电区内变电设备总容量与供电区最大负荷(网供负荷)之比,反映容量备用情况 |
| C2/(kV⋅A/户) | 1.5~3.0 | 指负责居民供电的配电容量与居民用户数之比,反映供电能力情况 | ||
| C3/% | ≤5 | 指重载线路与全部线路之比,反映区域重载线路情况 | ||
| C4/% | ≤5 | 指重载主变与全部线路之比,反映区域重载主变情况 | ||
| B2 | C5/% | B类区, 100;C类区, ≥80;D类区, ≥60 | 指线路中满足N-1的比例,反映线路中的分段情况 | |
| C6/% | B类区, 100;C类区, ≥90;D类区, ≥75 | 指主变满足N-1的比例情况 | ||
| C7/% | B类区, ≥90;C类区, ≥80;D类区, ≥60 | 反映地区线路联络情况 | ||
| C8/km | B类区, ≤3;C类区, ≤5;D类区, ≤15 | 指从变电站(配电变压器)二次侧出线到其供电的最远负荷点之间的线路长度 | ||
| B3 | C9/% | B类区, 70~90;C类区, 40~60;D类区, 20~40 | 反映线路中电缆和架空绝缘线占线路总长度的比例 | |
| C10/% | 0 | 反映地区高损配变情况 | ||
| C11/% | — | 反映配网系统内的电缆长度占总线路长度情况 | ||
| B4 | C12/% | B类区, ≥99.965;C类区, ≥99.863; D类区, ≥99.726 | 是供电可靠性的定量表示,供电可靠性是持续供电能力的量度 | |
| C13/h | — | 这2个指标反映电网供电可靠性情况 | ||
| C14/h | — | |||
| C15/% | B类区, ≥99.95;C类区, ≥98.79:D类区, ≥97 | 指实际运行电压在允许电压偏差范围内累计运行时间与对应总运行统计时间的百分比 | ||
| B5 | C16/% | B类区, 100;C类区, ≥80;D类区, ≥70 | 从这3个指标可以看出地区智能设备的占比情况,从而反映电网智能化水平 | |
| C17/% | B类区, 100;C类区, ≥80;D类区, ≥70 | |||
| C18/% | B类区, 100;C类区, ≥90:D类区, ≥80 | |||
| A2 | B6 | C19/% | ≤6.63 | 这3个指标反映一个区域内总的线损,主要考量地区节能减排、损耗情况 |
| C20/% | ≤2 | |||
| C21/% | 0 | |||
| C22/亿元 | — | 这3个指标反映地区经营生产及收入情况 | ||
| C23/% | ≥58.9 | |||
| C24/% | ≥99.95 | |||
| B7 | C25/% | ≥10 | 反映地区电量增长情况 | |
| C26 | 0~1 | 指负荷增长与GDP增长的比值 | ||
| B8 | C27/次 | 0 | 电力安全生产的目标是维护电力系统安全稳定、保证电力正常供应,杜绝人身死亡、主设备严重损坏等重大特大事故 | |
| C28/次 | 0 | |||
| C29/次 | 0 | |||
| B9 | C30/% | 100 | 反映客户对服务满意度情况 | |
| C31/% | ≥2 | 这2个指标反映客户用电服务需求情况 | ||
| C32/% | ≥2 |
2 指标体系权重计算
2.1 基于改进CRITIC法的权重计算
式中:
第j个指标的权重计算如下:
2.2 基于熵权法的权重计算
1)第j个指标下第i个系统的特征比重表示如下:
式中
2)第j个指标的熵值表示为
式中
3)指标
4)指标
2.3 基于改进CRITIC-熵权法的综合权重计算
通过改进CRITIC法和熵权法分别计算出各指标的权重Wj 和Qj,另外,设各评价指标的综合权重为Tj。将评价指标体系矩阵
采用拉格朗日法对
3 案例应用
3.1 综合评价
表2 各指标权重值
Tab. 2
| 一级指标 | 权重 | 二级指标 | 权重 | 三级指标 | 权重 |
|---|---|---|---|---|---|
| A1 | 0.5 | B1 | 0.251 | C1 | 0.313 |
| C2 | 0.191 | ||||
| C3 | 0.256 | ||||
| C4 | 0.240 | ||||
| B2 | 0.276 | C5 | 0.264 | ||
| C6 | 0.264 | ||||
| C7 | 0.238 | ||||
| C8 | 0.234 | ||||
| B3 | 0.118 | C9 | 0.629 | ||
| C10 | 0.271 | ||||
| C11 | 0.100 | ||||
| B4 | 0.243 | C12 | 0.357 | ||
| C13 | 0.325 | ||||
| C14 | 0.175 | ||||
| C15 | 0.143 | ||||
| B5 | 0.112 | C16 | 0.363 | ||
| C17 | 0.487 | ||||
| C18 | 0.150 | ||||
| A2 | 0.5 | B6 | 0.207 | C19 | 0.434 |
| C20 | 0.057 | ||||
| C21 | 0.094 | ||||
| C22 | 0.145 | ||||
| C23 | 0.137 | ||||
| C24 | 0.132 | ||||
| B7 | 0.152 | C25 | 0.546 | ||
| C26 | 0.454 | ||||
| B8 | 0.382 | C27 | 0.275 | ||
| C28 | 0.089 | ||||
| C29 | 0.636 | ||||
| B9 | 0.259 | C30 | 0.537 | ||
| C31 | 0.236 | ||||
| C32 | 0.227 |
表3 评价结果及排名
Tab. 3
| 县级供电企业 | 电网发展评价 | 生产经营评价 | 综合评价 | 排名 |
|---|---|---|---|---|
| 平均水平 | 88.75 | 91.00 | 89.87 | — |
| 三营供电公司 | 84.64 | 83.57 | 84.10 | 17 |
| 彭阳县供电公司 | 85.30 | 91.23 | 88.26 | 11 |
| 西吉县供电公司 | 80.96 | 89.09 | 85.02 | 16 |
| 隆德县供电公司 | 85.50 | 88.51 | 87.00 | 14 |
| 泾源县供电公司 | 92.75 | 85.93 | 89.34 | 10 |
| 盐池县供电公司 | 86.99 | 94.00 | 90.49 | 9 |
| 红果子供电公司 | 96.26 | 90.26 | 93.26 | 6 |
| 平罗县供电公司 | 96.01 | 90.65 | 93.33 | 5 |
| 惠农供电公司 | 97.57 | 92.17 | 94.87 | 3 |
| 红寺堡供电公司 | 92.03 | 92.32 | 92.18 | 8 |
| 同心县供电公司 | 88.21 | 86.46 | 87.33 | 12 |
| 青铜峡市供电公司 | 90.44 | 95.56 | 93.00 | 7 |
| 永宁县供电公司 | 93.76 | 96.94 | 95.35 | 2 |
| 贺兰县供电公司 | 94.16 | 94.01 | 94.09 | 4 |
| 灵武市供电公司 | 95.52 | 96.27 | 95.89 | 1 |
| 中宁县供电公司 | 79.70 | 93.16 | 86.43 | 15 |
| 海兴供电公司 | 81.29 | 92.90 | 87.10 | 13 |
| 海原县供电公司 | 76.32 | 85.01 | 80.67 | 18 |
从表3可以看出,在18家县级供电企业中,灵武市供电公司评价结果高居榜首,永宁县供电公司次之,惠农供电公司位列第3。这3个地区的指标值大多较为均衡且处于高位,表明当地现状电网的结构装备、业绩及资产质量总体上优良。
3.2 诊断分析及建议
为了找出县域供电公司间的差异来源,采用根因分析的方法,通过横向对比分析供电公司指标差异,查找综合评价结果较低供电公司的薄弱环节,从而为提升公司电网发展及生产经营水平提供理论基础。通过对比各供电公司的综合评价结果可知,灵武市供电公司综合评价结果最高。通过计算电网发展维度和生产经营维度评价结果差异可知,导致其他供电公司与灵武市供电公司综合评价结果差异的主要维度有所不同,具体如表4所示。
表4 地区差异对比
Tab. 4
| 县级供电企业 | 与灵武市供电公司差异来源的占比/% | |
|---|---|---|
| 电网发展 | 生产经营 | |
| 三营供电公司 | 46.32 | 53.68 |
| 彭阳县供电公司 | 67.14 | 32.86 |
| 西吉县供电公司 | 67.14 | 32.86 |
| 隆德县供电公司 | 56.53 | 43.47 |
| 泾源县供电公司 | 21.26 | 78.74 |
| 盐池县供电公司 | 100.00 | 0 |
| 红果子供电公司 | -14.27 | 114.27 |
| 平罗县供电公司 | -9.72 | 109.72 |
| 惠农供电公司 | 0 | 100.00 |
| 红寺堡供电公司 | 100.00 | 0 |
| 同心县供电公司 | 100.00 | 0 |
| 青铜峡市供电公司 | 87.86 | 12.14 |
| 永宁县供电公司 | 100.00 | 0 |
| 贺兰县供电公司 | 37.67 | 62.33 |
| 灵武市供电公司 | — | — |
| 中宁县供电公司 | 83.68 | 16.32 |
| 海兴供电公司 | 80.99 | 19.01 |
| 海原县供电公司 | 63.22 | 36.78 |
表4中数据表示的是导致其他供电公司与灵武市供电公司差异来源的占比情况。以海兴供电公司为例,导致两者差异的主要来源是电网发展评价结果,占比为80.99%。因此需要对灵武市和海兴的电网发展维度指标进行深入分析,同时考虑18个县域的平均水平。本文主要从指标偏差
式中:
首先,计算2家供电公司电网发展维度18个指标的评价结果差异情况,具体如图3所示。
图3
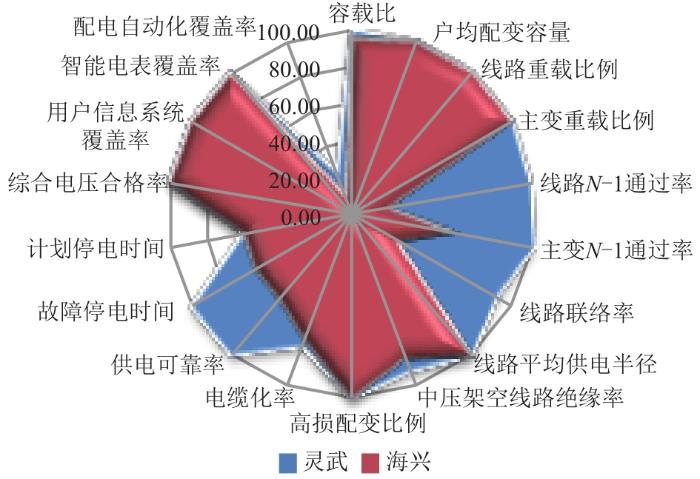
图3
电网发展维度指标评价结果对比图
Fig. 3
Comparison chart of power grid development dimension index scores
图4
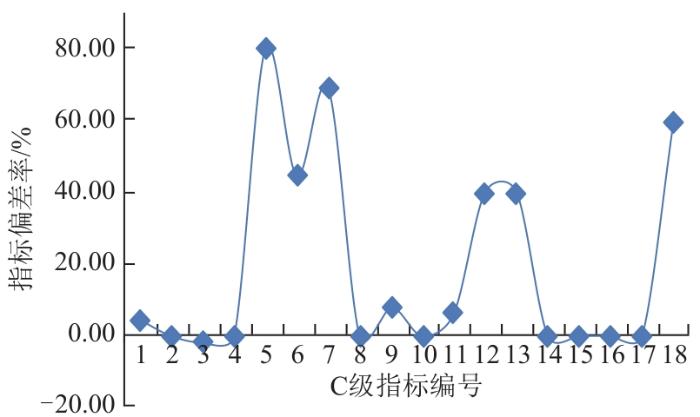
图4
2家公司电网发展维度指标偏差率
Fig. 4
Deviation rate of power grid development dimension index of two companies
图5
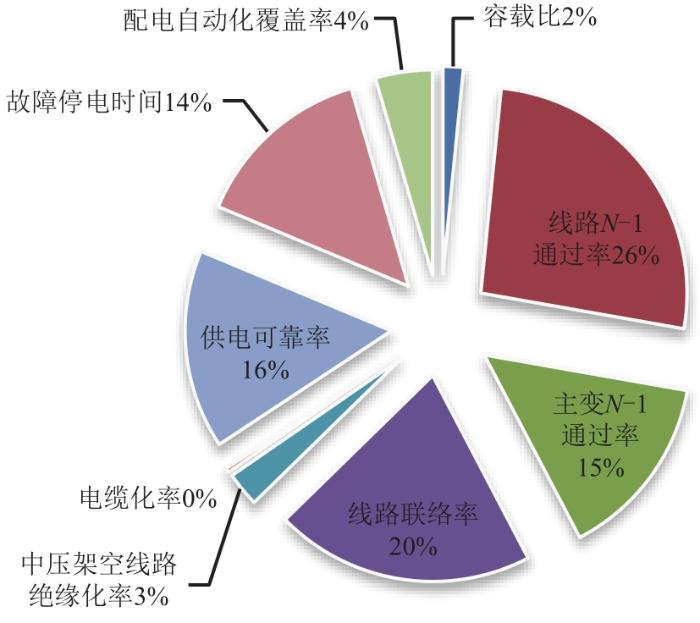
图5
2家公司电网发展维度指标偏差率占比
Fig. 5
Proportion of deviation rate of power grid development dimension index in two companies
从图5可以看出,导致海兴供电公司和灵武市供电公司电网发展维度指标偏差的主要原因是5个指标,包括供电可靠率(16%)、线路N-1通过率(26%)、线路联络率(20%)、主变N-1通过率(15%)、故障停电时间(14%)。
其次,计算电网发展维度下海兴供电公司与18个县域供电企业的平均水平对比情况,其各个指标评价结果对比如图6所示。
图6
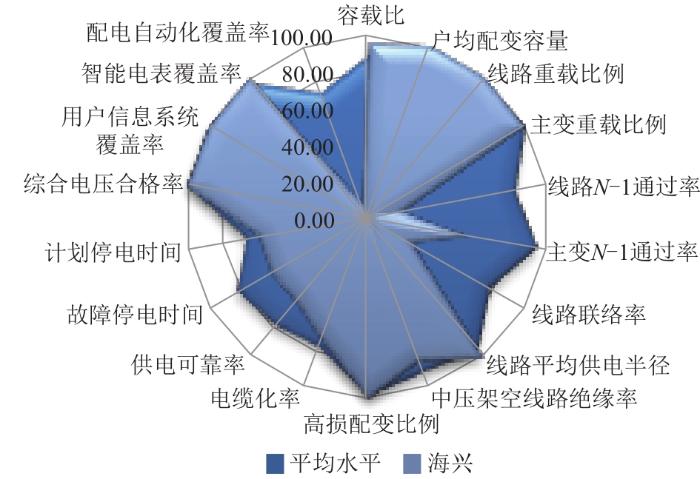
图6
海兴与平均水平指标评价结果对比
Fig. 6
Comparison of evaluation results between Haixing and average level
图7
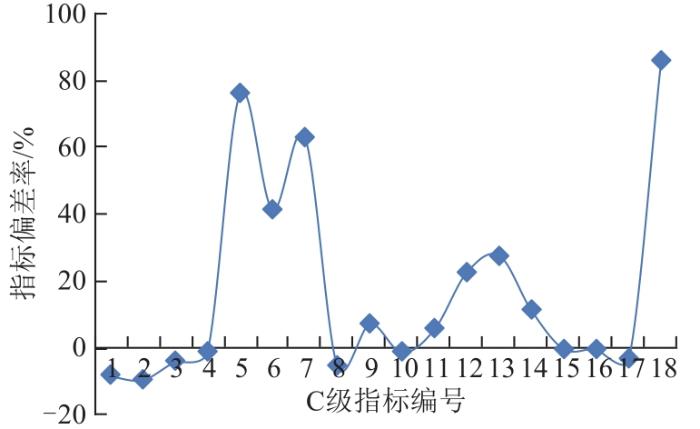
图7
海兴与平均水平电网发展维度指标偏差率
Fig. 7
Deviation rate of power grid development dimension index between Haixing and average level
图8
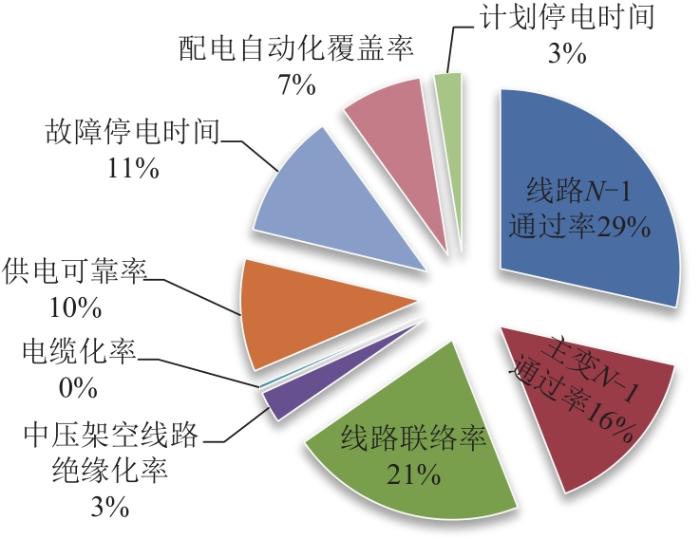
图8
海兴与平均水平电网发展维度指标偏差率占比
Fig. 8
Proportion of deviation rate of power grid development dimension index between Haixing and average level
从图8可以看出,导致海兴供电公司和平均水平电网发展维度指标偏差的主要原因是5个指标,包括供电可靠率(10%)、线路N-1通过率(29%)、线路联络率(21%)、主变N-1通过率(16%)、故障停电时间(11%)。因此,海兴供电公司应当从这5个方面加强管理、及时改善,从而为提高县级供电企业配电网发展经营水平奠定基础。
4 结论
以宁夏回族自治区18家县级供电企业为样本,通过构建县级供电企业配电网发展经营的评价指标体系,基于改进的CRITIC-熵权法设计指标权重,得出18家县级供电企业在电网发展、生产经营以及综合方面的发展水平,并通过根因分析发现,企业整体发展水平低大多是电网发展落后造成的。以海兴供电公司为例进一步分析,找出导致其综合评价结果低的主要原因是线路联络率、线路N-1通过率、主变N-1通过率、供电可靠率低以及故障停电时间长。研究案例结果表明,该方法是有效、合理的,有助于找到电网发展中存在的问题与不足,为把控县级供电企业配电网发展的重点方向起到重要作用,并为提高电网发展及生产经营效率奠定基础。
参考文献
县级供电企业工程项目精益化管理研究
[D].
Research on lean management of engineering projects in county-level power supply enterprises
[D].
县级供电企业现金预算精益化分析及优化管理策略研究
[D].
Lean analysis and optimal management strategy research on cash budget of county-level power supply enterprises
[D].
基于AHP的基层供电企业电网发展和生产经营评价体系研究
[J].
Research on grid development and production management evaluation system of grassroots power supply enterprises based on AHP
[J].
县级供电企业电网发展及生产经营数据分析与综合评价方法研究
[J].
Data analysis and comprehensive evaluation of power grid development and operation for county grid corporation
[J].
县级供电企业电网发展和生产经营综合评价方法及应用
[J].
Comprehensive evaluation method and application of power grid development and operation of county electric power company
[J].
基于全要素生产效率的县级供电公司综合评价
[J].
Comprehensive evaluation of county power supply company based on TFP
[J].
基于Delphi-AHP模型的电网发展及生产经营综合评价研究
[J].
Research on comprehensive evaluation of power network development and production management based on Delphi-AHP model
[J].
基于AHP和多级模糊综合评判的电网发展水平评估
[J].
Evaluation of power grid development level based on AHP and multi-level fuzzy comprehensive evaluation
[J].
基于SWOT-云物元理论的城市配电网发展形态评估方法
[J].
Evaluation based on cloud matter element theory for the development form of urban distribution network
[J].
基于“EGM-PCA”组合算法的县域配电网评估模型构建
[J].
Construction of county distribution network evaluation model based on “EGM-PCA”combination algorithm
[J].
城市配电网发展形态指标体系及其评估方法研究
[J].
Research on index system and its evaluation methods of urban distribution network development form
[J].
增量配售电公司评价方法研究
[J].
Comprehensive evaluation of incremental electricity distribution and retail company
[J].
基于改进的AHP-CRITIC组合赋权与可拓评估模型的配电网综合评价方法
[J].
Comprehensive evaluation method for a distribution network based on improved AHP-CRITIC combination weighting and an extension evaluation model
[J].
有源配网后评价指标体系及其综合评价方法
[J].
A post-evaluation index system of active distribution network project and its comprehensive evaluation method
[J].
基于启发式规则与AHP-CRITIC算法的配电网故障恢复策略
[J].
Service restoration strategy of a distribution network based on heuristic rules and the AHP-CRITIC algorithm
[J].
电能质量CRITIC-TOPSIS综合评价方法
[J].
Comprehensive evaluation of power quality on CRITIC-TOPSIS method
[J].
基于改进层次分析法、CRITIC法与逼近理想解排序法的输电网规划方案综合评价
[J].
Comprehensive evaluation of transmission network planning scheme based on improved analytic hierarchy process,CRITIC method and TOPSIS
[J].
计及P2G和CCS的园区级电-热-气综合能源系统多目标优化
[J].
Multi-objective optimization model for park-level electricity-heat-gas integrated energy system considering P2G and CCS
[J].
Prediction of photovoltaic power based on entropy weight combination forecasting method
[J].
基于层次分析法和熵权法的配电网调度评价
[J].
Assessment on distribution network dispatching based on analytic hierarchy process and entropy weight method
[J].
最低工资标准测算实证研究:基于CRITIC-熵权法客观赋权的动态组合测算
[J].
An empirical study on the calculation of minimum wage standard:dynamic combination calculation based on objective weight of CRITIC-entropy weight method
[J].
长三角一体化视角下制造业高质量发展评价研究:基于改进的CRITIC-熵权法组合权重的TOPSIS评价模型
[J].
Research on the evaluation of high quality development of manufacturing industry from the perspective of integration of the Yangtze River delta:TOPSIS evaluation model based on improved CRITICAL-entropy weight method
[J].
